
This essay is a transcription of my presentation at the Geological Society of America 2020 fall meeting, which, in keeping with the tenor of the times, was pre-recorded and presented remotely. The talk, titled “The mapboard, reimagined digitally — building a user interface tailored for field geological mapping”, was the first public presentation of my Mapboard GIS iPad app. I’m really proud of this software — it’s still very much a work in progress, but the beta is available, and it will be released on the public app store soon.
- The original video version can be found on YouTube.
- The abstract for the talk can be found at the GSA website.
- The transcript shown here has been lightly edited for clarity and concision.
March 2021 update: Mapboard GIS is now released on the public App Store!
See the release announcement and the project website.
Hello everyone, I’m Daven Quinn, a research scientist at University of Wisconsin–Madison, in the Macrostrat lab. I’m going to talk to you today about building a new generation of user interface tailored for field geological mapping. This has culminated in the Mapboard GIS iPad app, which is in beta. For more information on how to try out the app, you can head to the website.
Hand-drawn maps are effective
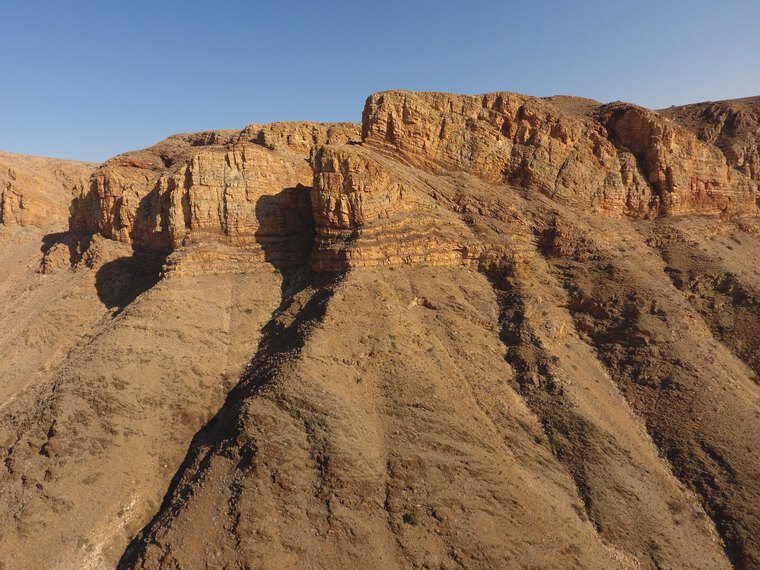
This saga started for me when I began a field mapping project in the Naukluft Mountains in southern Namibia, which is a series of fold and thrust nappes from the Neoproterozoic to Cambrian Damara origin.

At the geological survey in Windhoek, Namibia, you are confronted with a wall-sized, pencil-drawn version of this map of the Naukluft Mountains. It’s an imposing work, and a good set piece to consider the role of hand-drawn maps in our geologic mapping process.

Hand-drawn maps are the standard for geologic maps, as they have been since their inception — and for good reason! In addition to being technically approachable, hand-drawn maps have a tactile nature that makes them very amenable to building understanding of geologic relationships and phenomena by mimicking them on the page. While learning structural mapping in field camp, I rubbed maps on my mapboard raw with eraser, trying to capture a field pattern that matched what I saw. This iterative mapping process proved highly effective for me, and it’s a tactic I continue to employ to this day.
Paper maps are a pain!

When I arrived in Namibia in 2015, I had this paper-based mapping workflow in mind. I basically printed an atlas of field maps, because this was an exploratory mapping project and I didn’t quite know where the relevant detailed mapping would be. I spent about $140 to print about thirty 20k map sheets and some other index sheets, and spent a lot of time organizing this effort. And then when I got there, spent a lot of time taping different map sheets to mapboards.
This started seeming a little anachronistic, since most of the maps that we interact with in daily life are by now totally scale-independent. Even on my iPad in the field, I had a high-scale base map where you could resolve individual trees and, just as a digression, you could see zebra paths that turned out to be the best paths down from the plateau.
But my paper-based mapping workflow kept me going through my first field season. I moved around between different field sites on the edge of the plateau, using a different base map at each site, and built the regional picture by digitizing points for hours in my tent using QGIS until my battery would run out.
A new, digital workflow


So in this context, after my first field season, when the Apple Pencil came out, it basically blew my mind — it seemed like by far the best tool to do high precision regional mapping at multiple scales. So I bought an Apple Pencil and an iPad Pro and first tried this in FieldMove and, um, it kind of worked, but it quickly became apparent that you couldn’t do that much work or that quickly with it. So I corresponded with Midland Valley to see if they would add a few features to make FieldMove a better platform for pen based digitizing, and they suggested that they weren’t interested in future development. So with a classic amount of graduate student hubris, I rolled up my sleeves, started to learn Swift and started building the field mapping app that I wanted to see.

Mapboard GIS is a streaming digitizing app for the iPad and the Apple Pencil. It wraps a sophisticated geospatial information system (GIS) backend under simple editing tools for drawing and erasing different line and polygon types, and it also has snapping capabilities for closing linework, the ability to add and remove line types, and to add different units as polygon swatches. It also integrates a layer switcher and allows the ability to set different basemaps. The simple editing tools provided by Mapboard GIS make it easy to do even complex GIS operations using the onboard Spatialite backend.
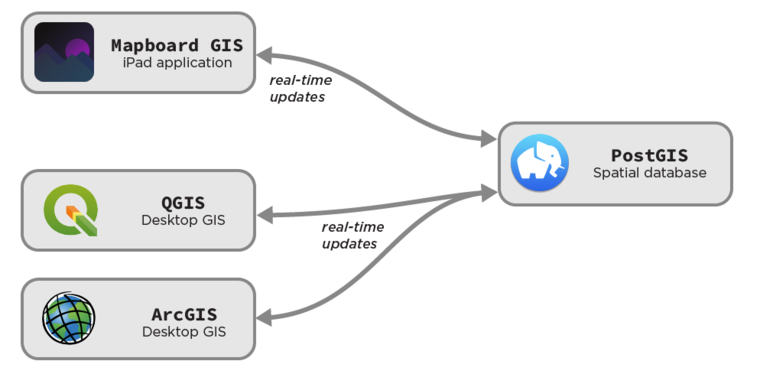
When using typical field mapping workflows, the transition to desktop map production is a time-consuming process. Mapboard GIS typically runs in a field mapping mode, using an onboard Spatialite database that can be easily read by desktop GIS software, but it also has a “couch mapping mode,” where it runs tethered to the computer and a PostGIS spatial database. This enables mapping at larger scale, using the greater power of a desktop GIS system. It also enables collaborative mapping and direct, real-time interfaces to ArcGIS and QGIS. In tethered mode, Mapboard GIS functions identically to how it functions standalone, but it can load much larger data sets due to co-processing with the more powerful computer.
Existing GIS workflows are inflexible
You might suggest that, between desktop GIS software and emerging field GIS tools, there are plenty of programs with stream digitizing capabilities, so why add another one? And it’s hard to overstate how important having a simple user interface is to effective and quick editing. This example of TouchGIS shows the common GIS problem of falling back to point based editing for all operations.
But the problems of traditional GIS workflows for geologic map production actually go much deeper. This tutorial on how to construct a geologic map in ArcGIS, from Roman DiBiase’s geomorphology lab, is a good example of that. Not to pick on Roman; this is one of many similar tutorials that I’ve found, and it is aligned with best practices. The instructions cover the steps of loading data into ArcGIS, closing and snapping linework, constructing polygons, and how to layout and design your map.
But as we scroll down through this, all we’re seeing is dialog boxes and check boxes, and more dialogues and, oh, there’s one point on a map, and so on… but we’re not seeing that many maps in this process. The whole workflow is time-consuming and very incompatible with iterative mapping. We eventually get to a geologic map, but it needed to be fully defined before we started the digital process.
Iteratively solving topology
Topology is a property that geologic maps share with other space-filling planar graphs, and it’s the reason why you usually have to solve the line work of a map before adding polygons — the polygons must be mathematically solved from the linework. Mapboard GIS has a built-in iterative topological solver, making it possible to solve the linework of a geologic map as you draw it.
This is a geologic map of the Hurricane, Utah and Zion National Park region, and here we’re drawing new unit polygons in areas not covered by our original map. We can enclose areas with linework and change the units within those areas, and the polygon will snap out to fill the space bounded by these contacts. Then we can add another enclosing polygon around this mesa and assign it to the correct map unit; we can do the same for an area of probable colluvium.
Then, if we look at our previously digitized linework, it’s possible to change the map that has already been created. We can also add new polygon types and detached topology segments. This is a really powerful tool, and in my opinion also extremely good for teaching, because you can show students how to create a geologic map and have them see the results returned to them in near real time.

All of this topology work can be done using the onboard Spatialite database in Mapboard GIS, but the really effective way to work with topology is to use the fully realized version of the tethered mapping mode with a topologically enabled PostGIS database. Another project that I have created that is closely related to, but independent from, Mapboard GIS is this PostGIS Geologic Map project, which manages a schema and an iterative topology solver that can work with any GIS system. Here is an example of PostGIS Geologic Map being used within QGIS at the Wisconsin Geologic Survey. Using Mapboard GIS in conjunction with PostGIS Geologic Map allows you to solve topology in real time, even for very large geologic maps.
Conclusions and next steps


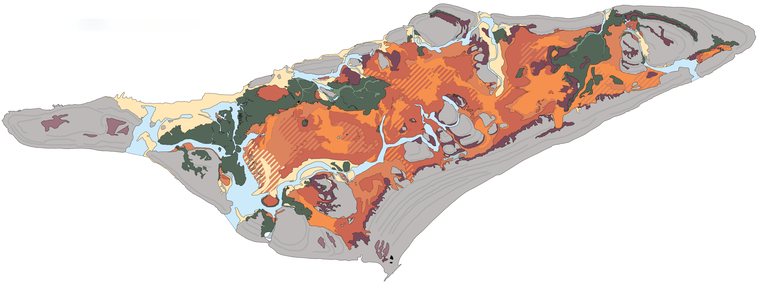
The Mapboard GIS app has been used in conjunction with the PostGIS Geologic Map topology solver in several mapping projects by myself and collaborators: this preliminary geologic map of the southern Naukluft Mountains, some of my PhD mapping in northeast Syrtis Major, Mars and finally, a large-scale collaborative mapping project at Little Ambergris Cay, Turks and Caicos Islands.
I think Mapboard GIS has path-breaking capabilities that illuminate the possibilities of good user-interface design to inform better workflows in the geosciences. The next steps for this project are a variety of performance fixes and optimizations, a few new features, and most critically a public app store release. But for now, you can check out the beta app on TestFlight. So head to the website for more information, and thank you very much for listening!